Work / Beverages · On-trade sales and investment
The outlet, the contract and the investment in one platform.
An international beverage company whose on-trade sales force worked across 22 separate tools. We redesigned the commercial and investment process around the potential of each outlet and built the platform that now runs it.
The companyAn international beverage company with a sales force dedicated to the on-trade: bars, restaurants and hotels. Its reps manage a portfolio of outlets, sign supply contracts with them and request investment and financing to win or keep each account, with regional managers and a finance team approving every step.
How it workedReps moved between 22 separate tools to manage their outlets, prepare contracts and request investment. More than 15 contract types each followed their own route to preparation, approval and filing. Investment and financing requests were calculated by the finance team in a spreadsheet model, and sell-out data reached the company through a paid third-party aggregation service. There was no shared view of which outlets had the most potential.
What was built
One platform between the sales team, the customer and the ERP.
The path of an investment request today, from the visit to the agreement in the ERP.
platformSystems
Inside the platform
The screens the sales team works in every day.
CONFIDENTIALCustomer and employee names masked
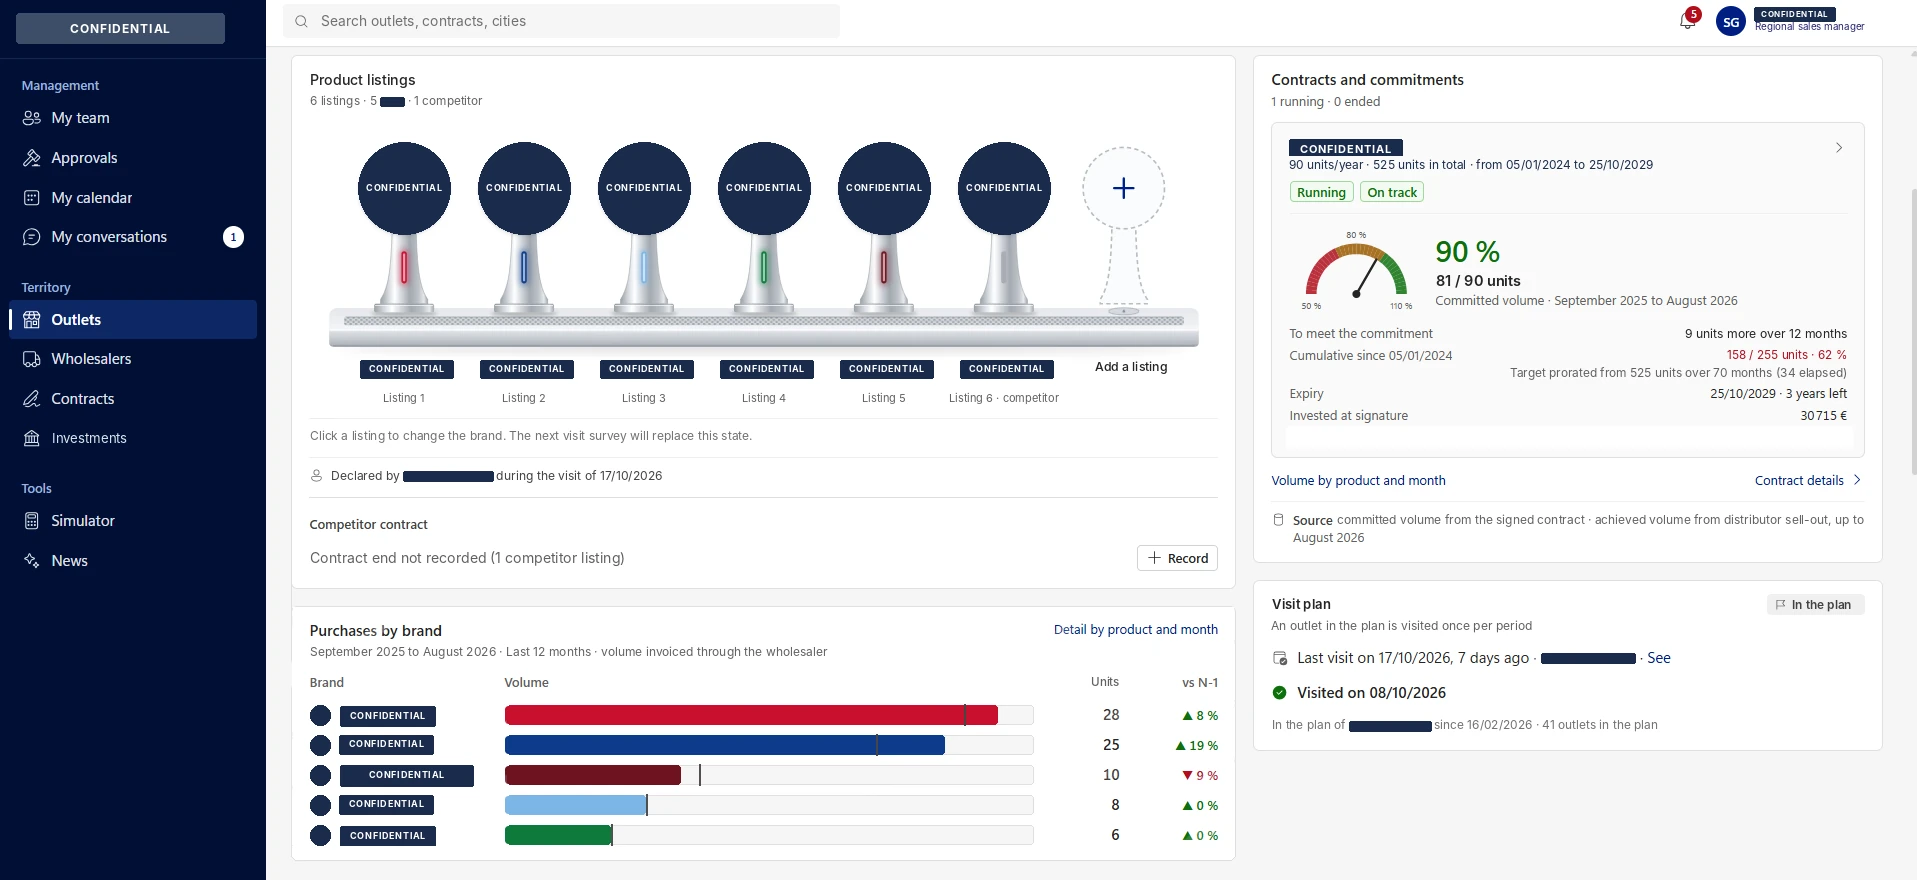
- Products listed at the outlet, updated at each visit
- Committed volume against actual purchases, with what is left to meet the commitment
- Purchases by brand over the last 12 months against the previous year, read from distributor data
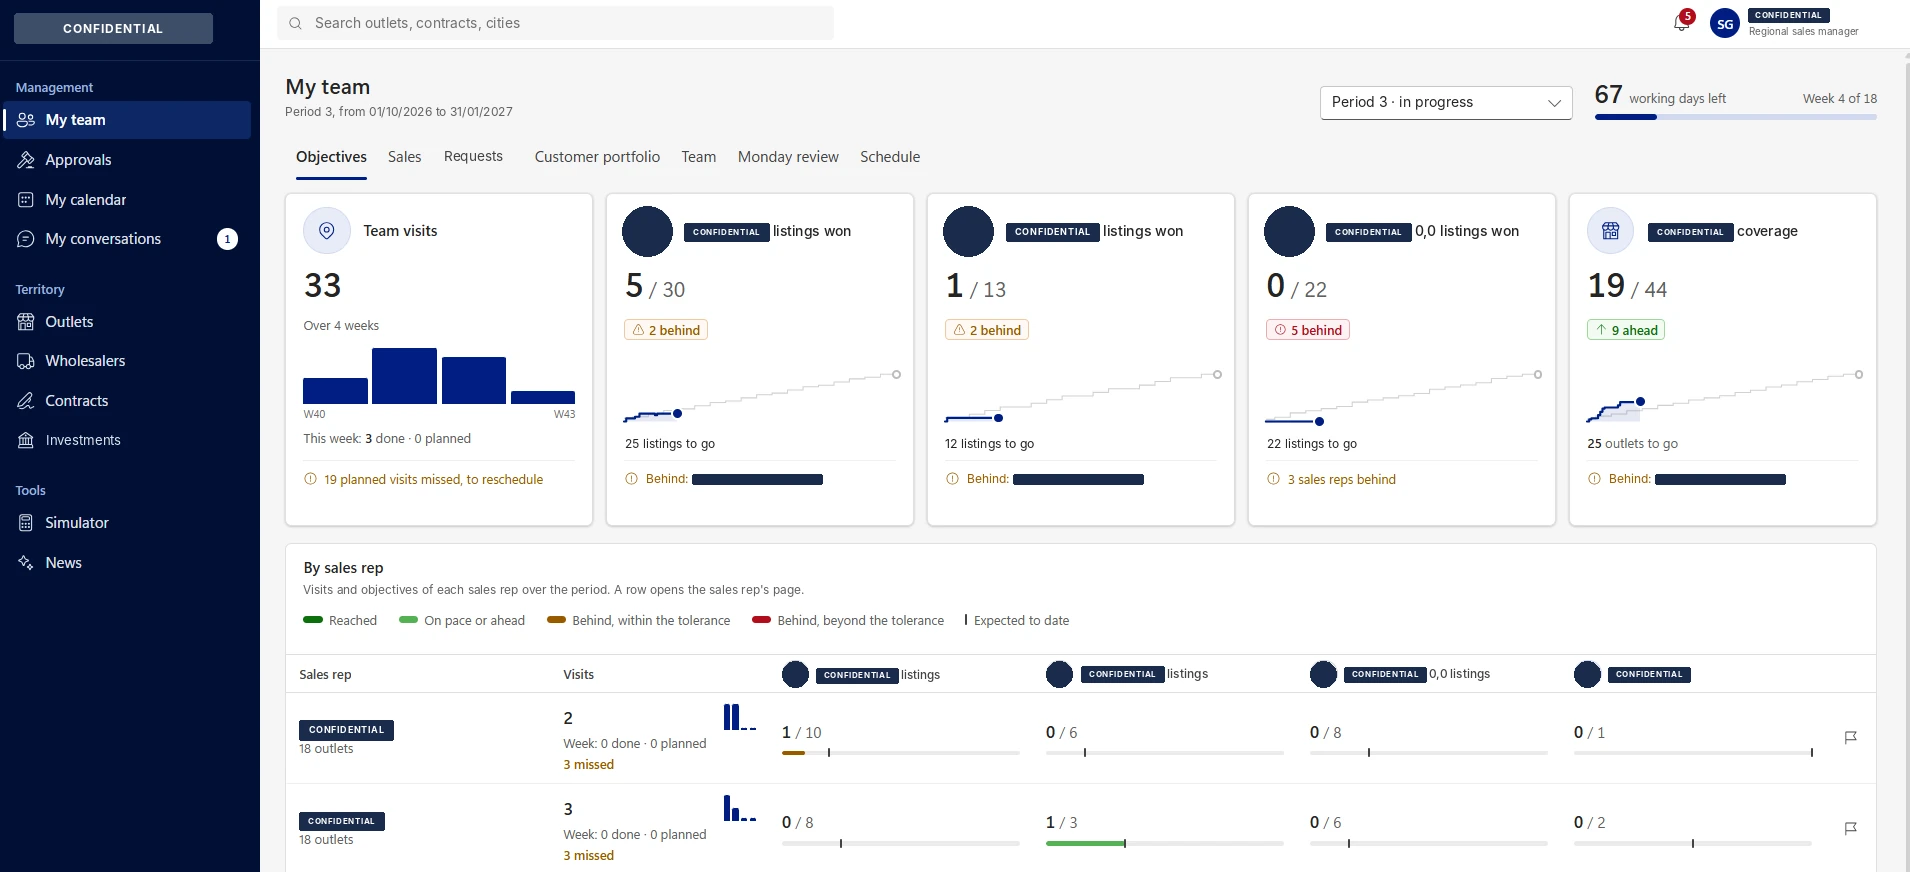
- Progress on each objective set against the pace expected to date
- Reps ahead or behind flagged on every objective
- Missed visits listed so they can be rescheduled